During 2021 I wanted to put in practice some of the mechanical engineering knowledge that I acquired, as well as getting some operational data on a regular car daily operation.
I owned a Honda Civic for 6 months for this purpose and today I am creating an analysis on the costs associated with owning a car.
But 2022 was a year of re-discovering the bike for me. And yes, I managed to save enough data to make a comparison between them.
Wondering How much is affecting me the Gas price increase? Lets find that out:
Car’s Data - Year 2021
Initial costs:
- Car’s value - 600$
Operation costs:
- Insurance - 400$
- Gas - (average per litre cost of 1.1$/L) - 125$
- Reparations - 150$ the ones that I made
- Workshop - 200$
Distance travelled:
- Discovering trips: 1200
- City/Short trips (15,20 km trips, most likely avoidable): 600
During the operation, the split of the cost was:
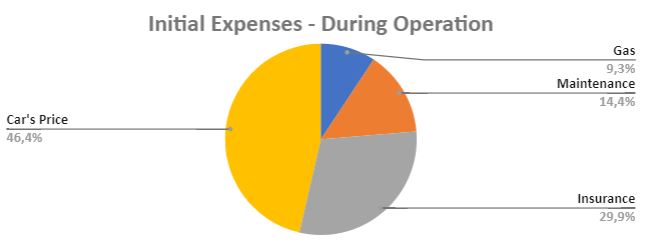
The average cost per km counting only longer trips 1,6$/km, considering all of them (before selling the car) is 0,8 $/km.
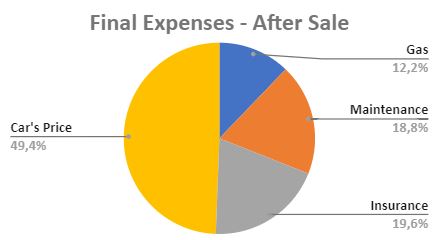
But what about the car’s value? After selling the car then the final cost per km is lower. Correct.
Once I sold it (and got partial refund of the insurance for the months that I did not used), the final cost per km (counting all of them) stayed at 0,6 $/km , and the split of the costs:
Bike - Year 2022
Initial costs:
- Bike - 300$
- Automatic boots & Shimano pedals (optional) - 100$
Operation costs:
- Repair kits (provisioning) - 50$
- Workshop visits - 30$
Distance achieved:
- Discovering trips: 2200 km
- City commuting: 1100 km
Comparison
Cost per KM during the test
On the period when i have run the experiment, i achieved:
- The bike’s output was 3300km, that makes 0,15 $/km
- The car’s output was 1800 km, that makes 0,6 $/km
Operating cost
Its important to notice, that the operating costs for the car are way greater than for the bike:
- Car - Considering gas cost only (km):
Assuming that the average litre price would stay the same on the long run and a perfect world, our target cost per km when a huge amount of them is done would be -> 1,1$/L * 5 L/100km = 5,5 $/100km
Or in another way, if the car would last forever as it is, no insurance needs to be paid, no taxes and so on, then it would require 0,05 $/km.
That’s 10% of the cost obtained and the best possible target the we are aiming at while driving.
Notes: I actually achieved a 5,88 L/100km while owning the car and that is on the low percentile for that engine.
- Car - Considering real world operating costs (km):
To the previous amount, we have to add insurance and reparations which for the time I owned it were 0,2 $/km, making a new target cost per km of -> 0,2 $/km +0,05 $/km = 0,25 $/km.
This is the ideal per km cost, when a lot of kilometres would be done, so that the initial car cost looks like nothing.
Notes: The car I bought was second hand and I wanted to change some mechanical parts, like tires and spark plugs, so this part is bigger than in a new car. But in that case you have to add the monthly settlement of debts to the per km cost. That amount will be higher than (200+150) 350$ in 6 months.
- Car - Considering real world operating costs (yearly):
Even if you have your car and drive it almost nothing during a year, you will have to pay at least the insurance, to make that 1km legally.
That would do 400$/year in my case.
- Bike - (km)
New chain every 2000km - 15$ Tires and lubrication every 1000 km - 50$ I am overestimating it since I haven’t used fully the tires yet, neither the initial lubricants that I bought Learn how to change tires and chains - 0$ with internet
This makes a total of 57.5$, lets say 60$ per 1000 km -> 0.06$/km
- Bike - (yearly)
Good news here, if you don’t drive it, you don’t have to pay operational costs -> 0$/year
- How about renting a car? (km)
I have rented cars in several location during holidays and the cost per km range that I got is:
- Lancia ypsilon, Italy -> 0,68 eur/km
- Suzuki Vitara, Greece -> 1,54 eur/km and priceless lesson learnt of making car’s booking in advance
Concluding the experiment
This is not a matter of car vs bike.
With the car those km were done on an average speed of 80km/h, effortless, no matter what.
The bike is definitely having an advantage in cost per km (0.06 $/km vs 0.6 $/km) but sustaining an average speed higher than 20km/h can be a challenge and you are expose to the climate.
Typical Q&A:
Why my car consumption is higher than the ones measured here?
In short distances, the internal combustion engines are not operating at their optimal temperature, therefore the litres expended for short distances are way higher.
Note: To have a lower range on the energy that is ‘wasted’ while the engine is cold, think that only the block is about 100kg of metal that has to be heated up from 25C to 90C.
What’s the cost of the calories expended while biking?
Let’s say that we want to know the total cost to move us from A to B and we are not interested about the physical exercise benefits that we will obtain.
In this case, we need to add to the bike cost the cost of the energy we spend to move.
Depending on our rhythm, and many more factors this will vary, but we can take:
-
In Google we can find that around 500 calories and hour is what we should expect.
-
I have measured myself and to sustain a 22km/h average during one hour I am expending 700 calories.
If we go with the second and consider that we get the energy from nuts (why not), 100g of them would provide 500 Kcal, so we would need 140g of nuts.
Considering a price of 10$/kg of nuts, you got it, that would make 1,4$ to move 22km => 0.06$/km on feeding the human with energy.
We can add that to our previous (pure mechanical cost of the bike), to have 0.12$/km
How much is affecting me the increase in gas price?
As you can see from the analysis, the gas costs was between 9-12%.
While renting cars, I got a gas cost range of 13,5% (Vitara renting cost was quite high) and 39% (it was a great deal during 2020 and quite a lot of km).