Creating a Shiny Dashboard
Inflation levels is a topic that is currently more and more listened. This will be the topic.
In the end of 2021 I made a simple Shiny app that I deployed into ShinyApps, that was actually showing interactively the effects of inflation.
So let’s explain now the internals of that dashboard.
Math vs Controversy
I know that discussing retirement can be a controversial topic, depending with whom we bring up the conversation.
My goal with that simple app was to bring the math into those conversations, so that we could leave the emotions aside in the table and focus on the underlying data.
The Logic - How Does it Work?
As I said, I wanted to keep it simple.
So in the app only the following variables are considered:
- The yearly inflation rate
- Yearly savings (in fact, currency does not matter)
- Retirement expenses - how much we expect to spend (currency does not matter if we will expend it in the same country where we worked)
- Working age - the starting point of our career, from where our saving start to grow linearly
- Savings plateau - the age at which the increase rate of income equals increase rate of costs, experimentally I would assume this happens in the 30’s as in that age we have years of experience, but at the same time we might form a family or simply fall into life expenses inflation.
- Retirement age - the age at which we decide to stop working
The model assumes that no return on the savings are given, showing that in this case we are fully trusting our currency as a storage of value.
Libraries
-
Plotly - for interactive visualizations
- In the UI side, it has to be called with
plotlyOutput("SavingsEvolution")- In the server side:
output$SavingsEvolution <- renderPlotly({....}) -
Shiny - to build the app and have our filters
- sliderInput
- checkboxInput
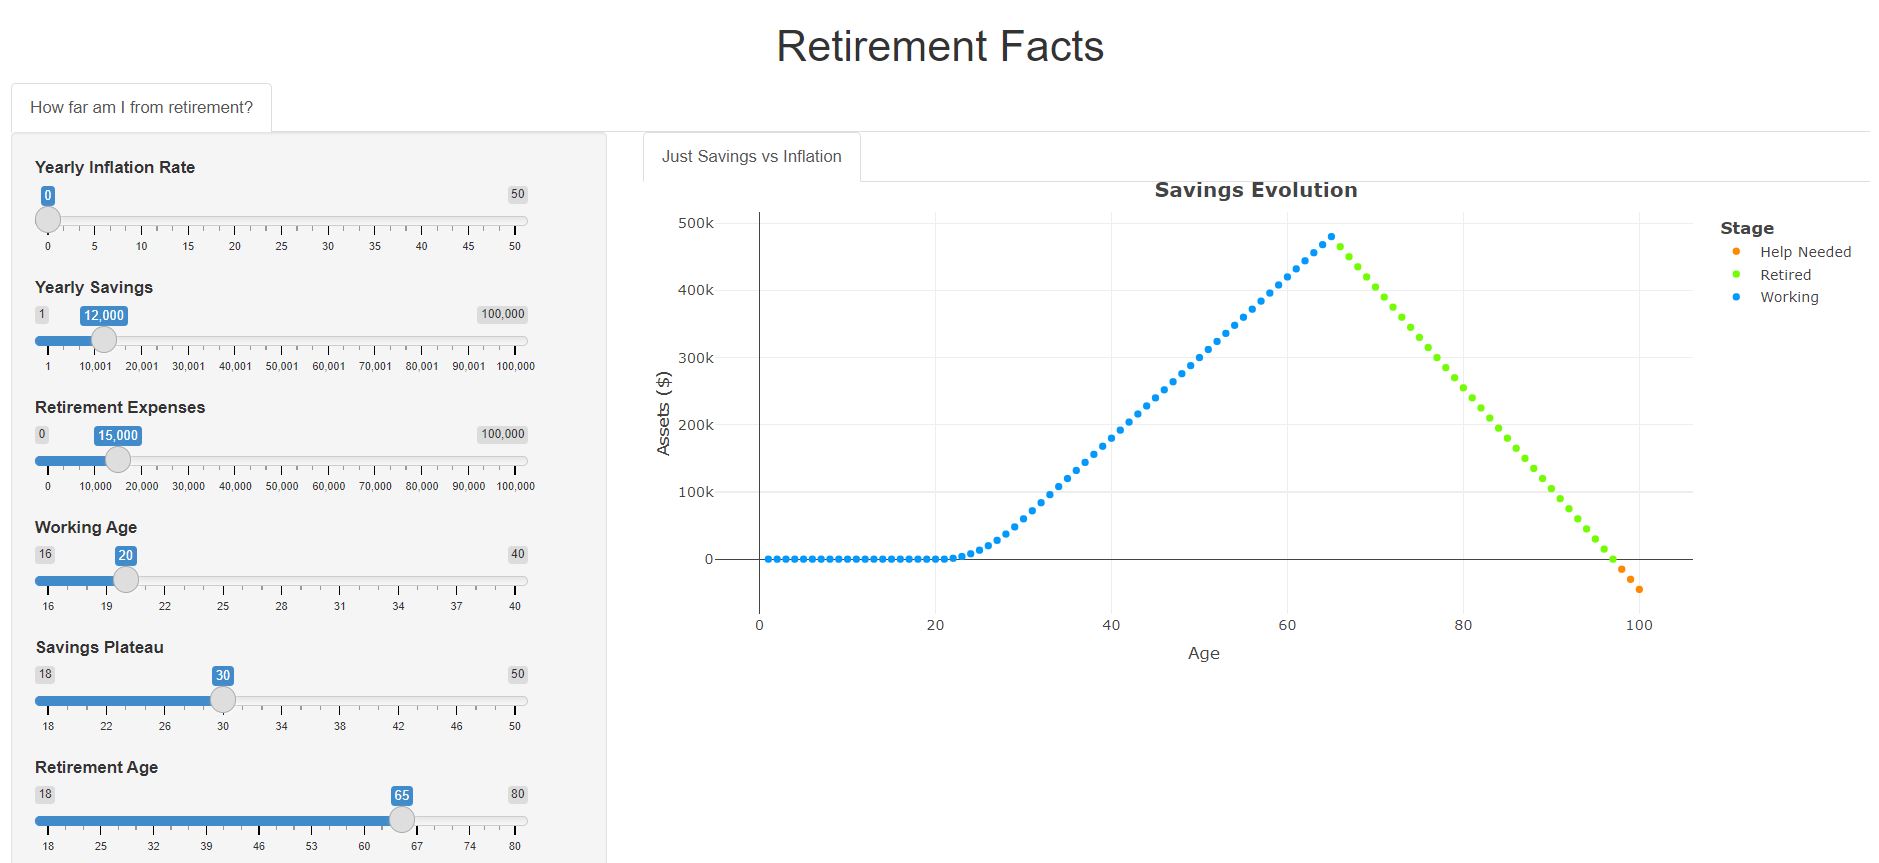
No Inflation vs “Mild” Inflation
The math is very simple for the case with no inflation, you save 1 at any given time, and you can expend the same amount later on:
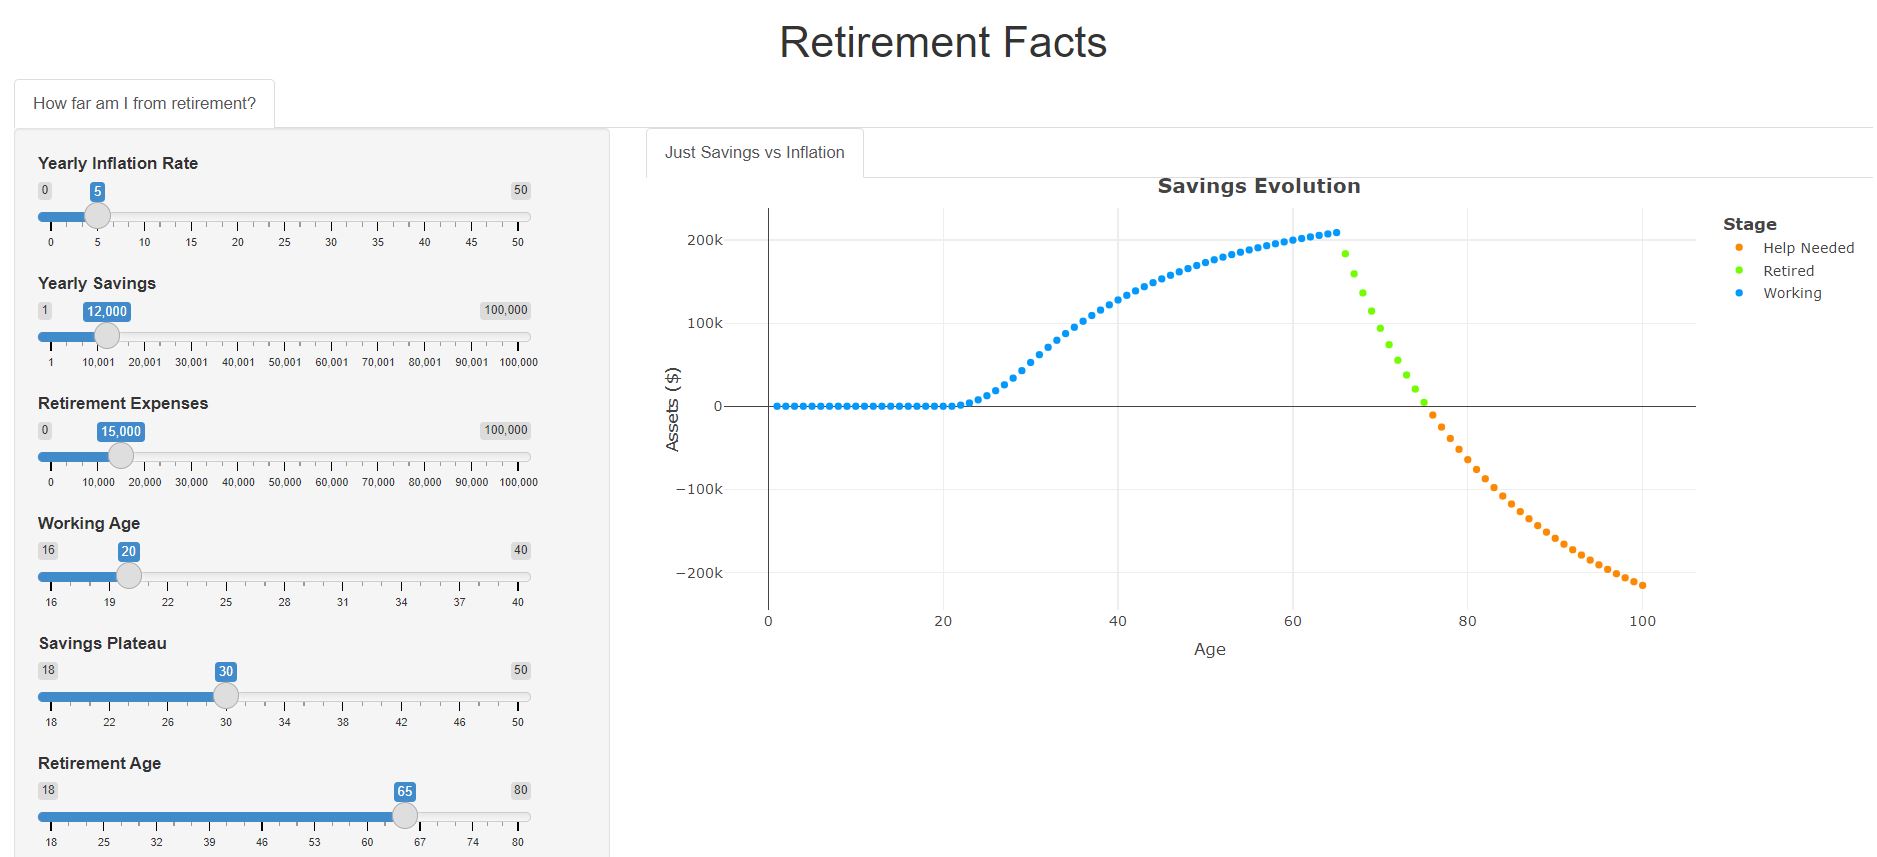
Next, you can compare with a case of a mild inflation of a 5% (example value of what could be expected yearly and long term on US or EU).
In this case we have to expect that savings will not grow lineally, but they will decay as one unit saved in the first year of your career will be loosing a yearly value of that 5%, yes, every year.
Also, during retirement, the effect will be present as well, so the savings will decay faster as we are consuming and suffering the inflation:
Conclusions
- I invite you to:
- Play with the App https://jalcocert.shinyapps.io/retirement_facts/
- Inspect the code https://github.com/JAlcocerT/R_is_Great/tree/main/ShinyApps
- Check my post to learn how to deploy your Shiny dashboard with ShinyApps
- Take a few minutes to think about this, as the example represented show that a 5% inflation rate make that person life savings last up to 75 years instead of 97.
Of course, the results of this dashboard just try to show one simple example on how to build and deploy your simple app with an interactive graph and must not been taking as a tool that provides any financial advice.