Trip Planner - Python Weather App
Are you planning your next adventure but want to make sure the weather is just right? Look no further! This Python Dash app that allows you to explore historical weather data for any location you’re planning to visit.
With this app, you can make informed decisions about the best time to travel and ensure a comfortable trip with lower chances of unexpected weather surprises.
This Dash app is an essential tool for any traveler looking to optimize their travel experience based on historical weather patterns.
I have already used it to plan the next stages of my bicycle trip: Cycling through Europe, as a continuation of the Poland to Hungary bicycle trip that I made last year.
Why do I need an interactive Python Weather APP?
Spring has arrived, and with it comes the desire to explore new countries and embark on fresh adventures. However, unpredictable weather conditions can often put a damper on our plans.
By understanding the typical weather patterns of your destination, you can plan and pack accordingly, minimizing disruptions due to sudden changes in temperature or precipitation.

I have been caught up by cold weather conditions and rain few times while exploring.
That’s where this Python-based weather app comes in! Built using open-source libraries, this powerful tool provides a comprehensive overview of historical weather data for any trip location you choose (that is included in meteostat).
The App - Trip Planner: Interactive Historical Weather in Python
The App is very simple to use, you will need to input:
- Your desired time range to look for Weather Data
- Click the location in the map
- Optional: for the boxplot, you can switch between Max/Min temperatures for a higher overview
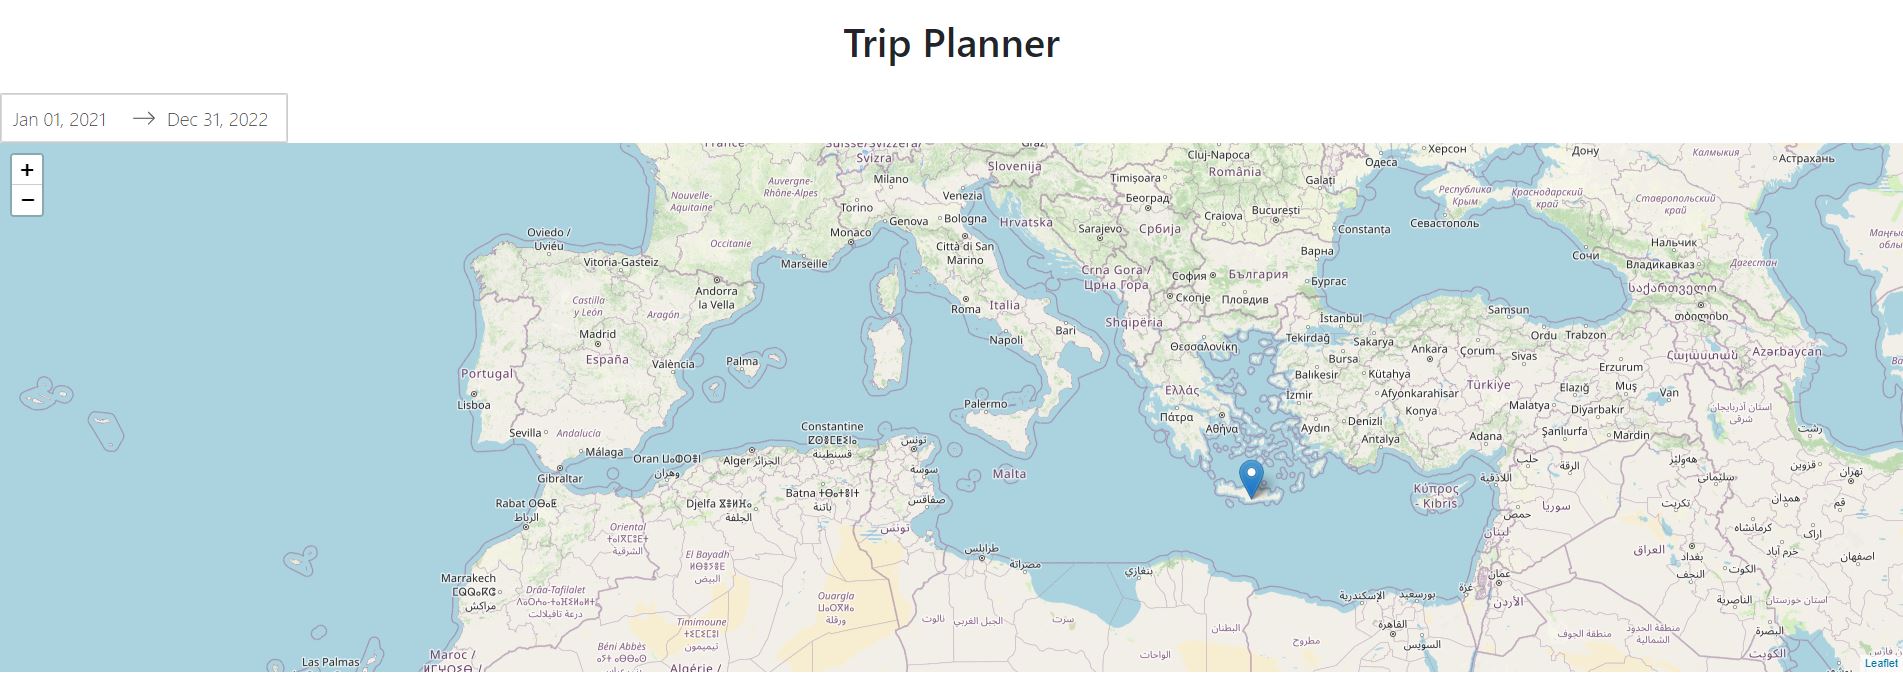
How does it looks like? As default you will find one example pre-selected in one of my favourite islands - Crete.
-
The map:
-
A lineplot with historical Max and Min temperatures for the selected location (when available):
-
A boxplot, that consolidates for the time range selected, what are the expected Temperature/Wind/Precipitation ranges for each month:
What is the App based on?
The app is fully open-sourced and it is possible thanks to the fantastic job of other projects, let me tell you about some of the main ones, as I was in need of:
- An interactive map
- A weather data source
- A dashboarding tool
In the next points I will be describing the packages that I chose to have those features covered.
Leaflet
Leaflet is a lightweight, open-source JavaScript library for creating interactive maps on web pages. It is designed to be easy to use, flexible, and performant, making it a popular choice for developers who want to create map-based applications or visualizations without the complexity of more feature-rich mapping libraries like Google Maps or OpenLayers.
I have been experimenting with leaflet for a while already, and just thought to give it a try for this project as well.
Meteostat
Meteostat is a Python library that allows users to access historical weather data and climate information from various sources, including weather stations and reanalysis datasets. It simplifies the process of fetching, processing, and analyzing weather and climate data for various applications, such as research, data analysis, or visualization.
Remember that not all latitude and longitudes will have the same historical availability and that some of them will have no data at all.
- The source code of this library: https://github.com/meteostat
- I have already created a post explaining how to use meteostat here
DASH
Dash is a Python library for building analytical web applications without requiring extensive knowledge of front-end web development technologies like HTML, CSS, or JavaScript. It allow us create interactive, data-driven web applications by only using Python code, making it an accessible and powerful tool for data scientists and analysts looking to share their insights through web-based visualizations and dashboards.
How can I try the Interactive Historical Weather APP?
Trying the app locally might be an easy process for people that are familiar with software development. But I want this project to help as much people as possible.
For that reason I deployed the app to Google Cloud Run following my guide and you can use it for free from any browser at: https://trip-planner.fossengineer.com/
How can I Contribute?
I have made all the code Open Source and this is the public Github repository where I have built the code, please feel free to have a look, experiment with the code and suggest any improvements:


