
Most self-hosters end up with the same problem: services spread across multiple servers, uptime tracked in a bookmark folder, and “is that thing still running?” answered by opening five browser tabs.
CoreControl was built to fix that.
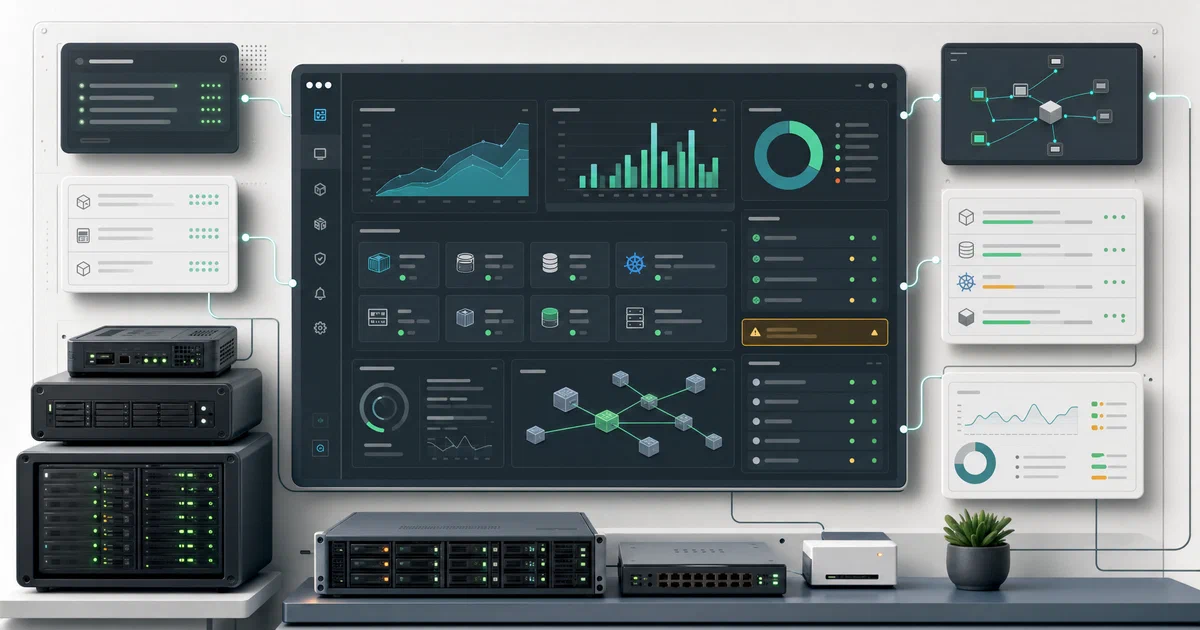
It is a lightweight, self-hosted infrastructure dashboard that gives you a single place to track your servers, catalogue your applications, monitor their uptime, and visualise your network topology.
What is CoreControl?
CoreControl is an open-source self-hosted dashboard focused on infrastructure organisation and awareness.
You register your servers with their hardware specs and management links, add your self-hosted applications with their URLs, and CoreControl monitors them continuously — alerting you when something goes down and keeping a history of availability.
“The only dashboard you’ll ever need to manage your entire server infrastructure.”
CoreControl Source Code on GitHub CoreControl Discord Community
What sets it apart
- 🖥️ Server catalogue — register servers with CPU/RAM/storage specs and quick-access links to management panels (Cockpit, Proxmox, Portainer, etc.)
- 📱 Application tracking — add all your self-hosted services with URLs and let CoreControl poll their status continuously
- 📈 Uptime history — see timeline graphs of availability, not just “is it up right now”
- 🌐 Network visualiser — build drag-and-drop network topology flowcharts that document how your infrastructure connects
- 🔔 Notifications — alerts when services go down or come back up
- 🤖 Go agent — lightweight monitoring component that collects server metrics via Glances
- ⚖️ MIT licensed — simple, permissive, truly free ❤️
CoreControl Tech Overview
CoreControl ships as three Docker containers sharing a PostgreSQL 17 database. The architecture is deliberately simple:
Browser → web container (Next.js, port 3000) → PostgreSQL
                                                    ↑
                          agent container (Go) ─────┘
                          (polls Glances on managed servers)
web — the Next.js application serving both the frontend UI and the API. Handles authentication (JWT), all CRUD operations for servers and applications, uptime polling logic, network topology storage, and the settings panel.
agent — a lightweight Go binary that reads server metrics from the Glances monitoring API and writes them to PostgreSQL. This gives CoreControl the server hardware monitoring data without requiring an SSH connection or a heavy agent.
db — PostgreSQL 17, the single source of truth for all data.
The frontend is built with TailwindCSS and shadcn/ui components, with React Flow powering the network topology builder and selfh.st/icons providing application icons — a nice touch that makes the app catalogue visually recognisable at a glance.
The GitHub repository is currently undergoing a backend rewrite using Elysia (TypeScript) on Bun, adding team-based multi-tenancy. The Docker images ship the current stable version.
Self-Hosting CoreControl with Docker
Get Docker 🐋
Install Docker on your system before proceeding:
- Linux: Official Docker Engine install guide
- Windows / Mac: Docker Desktop
Verify installation: docker --version && docker compose version
The setup is three services, one volume — as simple as it gets.
services:
  web:
    image: haedlessdev/corecontrol:latest
    ports:
      - "3000:3000"
    environment:
      JWT_SECRET: "replace_with_a_long_random_string"
      DATABASE_URL: "postgresql://postgres:postgres@db:5432/postgres"
    depends_on:
      db:
        condition: service_healthy
    restart: unless-stopped

  agent:
    image: haedlessdev/corecontrol-agent:latest
    environment:
      DATABASE_URL: "postgresql://postgres:postgres@db:5432/postgres"
    depends_on:
      db:
        condition: service_healthy
    restart: unless-stopped

  db:
    image: postgres:17
    restart: always
    environment:
      POSTGRES_USER: postgres
      POSTGRES_PASSWORD: postgres
      POSTGRES_DB: postgres
    volumes:
      - postgres_data:/var/lib/postgresql/data
    healthcheck:
      test: ["CMD-SHELL", "pg_isready -U postgres"]
      interval: 2s
      timeout: 2s
      retries: 10

volumes:
  postgres_data:
Save this as docker-compose.yml, then:
docker compose up -d
Open http://your-server-ip:3000 and log in:
- Email:
[email protected] - Password:
admin
Change the default password immediately in Settings after first login.
Services explained
| Service | Purpose |
|---|---|
web |
Next.js app — UI, API, uptime poller, JWT auth |
agent |
Go binary — collects server metrics from Glances |
db |
PostgreSQL 17 — all persistent data |
The only required configuration is JWT_SECRET — replace the placeholder with any long random string (e.g., openssl rand -hex 32). Everything else works with the defaults shown above.
The postgres_data volume holds all your servers, applications, uptime history, and network diagrams. Back it up with a regular docker exec db pg_dump or by snapshotting the Docker volume.
Hardening for production (change PostgreSQL credentials)
The defaults use postgres:postgres which is fine on a private network but weak if the database port is ever exposed. Update all three references consistently:
services:
  web:
    environment:
      DATABASE_URL: "postgresql://corecontrol:strongpassword@db:5432/corecontrol"

  agent:
    environment:
      DATABASE_URL: "postgresql://corecontrol:strongpassword@db:5432/corecontrol"

  db:
    environment:
      POSTGRES_USER: corecontrol
      POSTGRES_PASSWORD: strongpassword
      POSTGRES_DB: corecontrol
The PostgreSQL port (5432) is not exposed to the host in this compose — it stays on the internal Docker network between containers, which is safe.
Putting CoreControl behind a reverse proxy (HTTPS)
If you use Caddy as your reverse proxy:
corecontrol.yourdomain.com {
    reverse_proxy localhost:3000
}
Or with Nginx Proxy Manager, add a proxy host pointing to http://your-server-ip:3000. Caddy will automatically obtain a Let’s Encrypt certificate. Update JWT_SECRET to something strong before exposing it publicly.
What to do after install
1. Add your servers — go to Servers → Add Server. Fill in the hostname, IP address, hardware specs (CPU, RAM, storage), and any quick-access URLs (your Cockpit URL, Proxmox web UI, Portainer, etc.).
2. Add your applications — go to Applications → Add Application. Enter the name, URL, and pick an icon from the selfh.st/icons library. CoreControl immediately starts polling the URL for uptime.
3. Check the Uptime page — after a few minutes, the uptime page shows availability timelines for all your registered applications. Tune notification settings if you want alerts on state changes.
4. Build a network map — go to Networks and drag your servers and applications onto the canvas. Connect them with edges to document how your infrastructure is laid out. Useful during incidents.
Conclusion
CoreControl hits a genuinely useful spot between “just a bookmark folder” and “full-blown monitoring stack.” It does not replace Prometheus + Grafana for deep metrics, but for most self-hosters the question is not “what is the p99 latency of my Nextcloud instance?” but “is Nextcloud up, and where is the admin panel link again?” — and CoreControl answers both instantly.
The three-container Docker setup means the only barrier to entry is copy-pasting a compose file. The MIT licence and active Discord community suggest it will keep growing.
Alternatives worth comparing:
- Homarr — polished homepage with app links and widgets; no uptime history or network topology
- Uptime Kuma — best-in-class uptime monitoring; no server catalogue or network view
- Homer — ultra-minimal static homepage; YAML-configured, no dynamic monitoring
- Homepage — highly configurable dashboard with service widgets; more setup, more power
Frequently Asked Questions
Does CoreControl SSH into my servers to collect metrics?
No — the agent collects metrics via the Glances REST API. Glances must be running on the monitored server and reachable by the agent container. It does not require SSH access or a system agent.
Can I use CoreControl without the agent?
Yes. The web container runs standalone. You lose the server hardware monitoring data, but all other features (application tracking, uptime, network visualiser) work fine without the agent.
Is there a mobile app?
Not yet. The Next.js web app is responsive and works in mobile browsers. A native mobile app is not on the current roadmap.
How often does CoreControl check application uptime?
The polling interval is configured internally in the web container. Check the Settings page for the current value and whether it can be adjusted.
What happens to my data if I update to a new image version?
The PostgreSQL data lives in the postgres_data Docker volume, which persists across docker compose pull && docker compose up -d updates. The application runs any necessary migrations on startup.
The repository looks sparse — is this project abandoned?
No — the Docker images are actively maintained and published. The repository currently contains a ground-up rewrite of the backend using Elysia (TypeScript/Bun) with team-based multi-tenancy. The existing stable product ships as pre-built Docker images while the rewrite matures.
Comments