
There are two kinds of uptime monitoring tools.
One kind gives you a hosted dashboard and asks you to trust someone else with your checks, incidents, status pages, and notification routes.
The other kind lets you keep that monitoring stack close to the services it watches.
Kuvasz is in the second group.
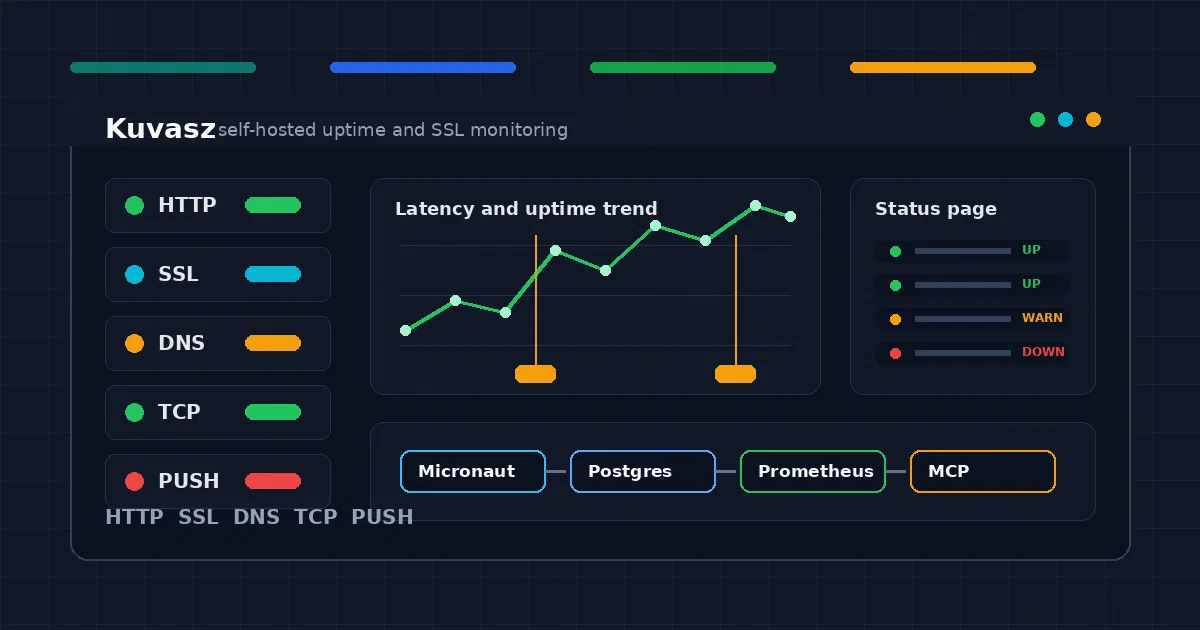
It is a self-hosted uptime and SSL monitoring service with HTTP(S), push heartbeat, ICMP, TCP, and DNS monitors, plus status pages, REST API access, YAML-based infrastructure-as-code configuration, maintenance windows, Prometheus/OpenTelemetry exports, and an optional MCP server for AI-assisted operations.
The useful thing about Kuvasz is not just that it checks websites.
It brings several practical monitoring modes into one small self-hosted application.
What is Kuvasz?
Kuvasz is an AGPL-3.0 monitoring service written primarily in Kotlin.
It tracks service health through several monitor types:
- HTTP(S) monitors for websites and APIs
- SSL certificate checks for expiry and certificate validity
- push heartbeat monitors for jobs that report in
- ICMP monitors for host reachability and latency
- TCP monitors for services that should accept socket connections
- DNS monitors for resolver behavior and expected records
It also includes public or private status pages, maintenance windows, multiple notification integrations, REST API endpoints, metrics export, and YAML configuration for people who prefer version-controlled monitor definitions.
That makes it closer to an open self-hosted monitoring control plane than a single-purpose page checker.
Why It Is Useful
Uptime monitoring gets more valuable when it is close to your actual operations.
For a homelab or small self-hosted stack, Kuvasz can answer practical questions:
- Is my public site reachable?
- Is my reverse proxy returning the expected status?
- Is my SSL certificate close to expiry?
- Did my backup job send its heartbeat?
- Is DNS still returning the records I expect?
- Can a TCP service accept connections?
- Should users see a public status page during an outage?
- Should planned maintenance suppress alerts?
That last part matters. Monitoring is not just checks.
It is also how the system decides when to notify, when to stay quiet, and how to explain state to users.
Tech Overview
The repository is a Gradle multi-module Kotlin project:
app/       Micronaut application, controllers, services, monitoring logic
model/     database migrations, generated jOOQ records, DTOs, validation models
shared/    shared utilities, i18n messages, app metadata
ui/        Kotlin-rendered UI pages, static assets, JavaScript, CSS
docs/      MkDocs documentation and OpenAPI output
helm/      official Helm chart
The backend uses Micronaut with Netty. Persistence is PostgreSQL, Flyway, HikariCP, and jOOQ.
The UI uses server-side Kotlin page generation with HTMX/Tabler-style frontend assets rather than a separate SPA.
Selected dependencies and platform choices:
Kotlin 2.4.10
Micronaut 5.1.3
Java target 25
jOOQ 3.21.7
Flyway
PostgreSQL
Micrometer
Prometheus exporter
OpenTelemetry exporter
dnsjava
Simple Java Mail
Pebble templates
Playwright for UI tests
Testcontainers for integration tests
The application entrypoint is com.kuvaszuptime.kuvasz.Application, which starts Micronaut without a banner and declares OpenAPI metadata for the API surface.
Source Layout
The core backend packages are easy to reason about:
controllers/         REST and web controllers
controllers/monitor/ HTTP, push, ICMP, TCP, and DNS monitor APIs
controllers/statuspage/ status page APIs
controllers/settings/ settings API
controllers/ui/      web UI controllers
services/check/      monitor schedulers and check implementations
services/check/http/ HTTP response, header, body, status, and latency checks
services/check/ssl/  SSL certificate validation
services/check/push/ heartbeat checks
services/check/icmp/ ping checks
services/check/tcp/  TCP connect checks
services/check/dns/  DNS resolve checks and record normalization
services/integrations/ notification integrations
services/maintenance/ maintenance windows and scheduling
services/statuspage/ status page data and imports
metrics/             Prometheus/OpenTelemetry meter exports
mcp/                 MCP tools and schemas
repositories/        jOOQ-backed persistence layer
config/              YAML/env configuration model
security/            API key, UI auth, and OIDC support
The database migrations show the product growing over time: initial monitors and uptime events, latency indexes, SSL objects, PagerDuty integration, status pages, push monitors, ICMP monitors, maintenance windows, TCP monitors, DNS monitors, and failure-threshold fixes.
That history matters because Kuvasz is not just a wrapper around curl.
It has a real persistence model for monitors, events, metrics, incidents, maintenance windows, status pages, integrations, and configuration state.
Configuration
Kuvasz is configured with environment variables and an optional mounted YAML file.
The Docker image expects YAML configuration at:
/config/kuvasz.yml
Important environment variables include:
DATABASE_HOST
DATABASE_PORT
DATABASE_NAME
DATABASE_USER
DATABASE_PASSWORD
ADMIN_USER
ADMIN_PASSWORD
ADMIN_API_KEY
ADMIN_MCP_API_KEY
ENABLE_AUTH
ENABLE_OIDC
ENABLE_MCP_SERVER
ENABLE_METRICS_EXPORT
ENABLE_PROMETHEUS_EXPORT
ENABLE_OTLP_EXPORT
PUBLISH_DEFAULT_STATUS_PAGE
EVENT_DATA_RETENTION_DAYS
LATENCY_DATA_RETENTION_DAYS
The YAML file is where Kuvasz becomes infrastructure-as-code. You can define monitors, integrations, status pages, and maintenance windows in a version-controlled file.
The tradeoff is important: when a monitor type or status page is defined by YAML, Kuvasz treats those objects as externally managed, so the UI/API can become read-only for that category.
That is the right behavior for GitOps-style monitoring because the source of truth stays in config.
Self-Hosting Kuvasz with Docker
The upstream docs recommend Docker Compose for quick starts, and the repo includes an official docker-examples/docker-compose.yml.
For this site, I added a pinned, secret-safe compose snippet. It uses Kuvasz 4.3.1, PostgreSQL via pgautoupgrade/pgautoupgrade:18-alpine, required interpolation for real secrets, no fixed container names, and a loopback-only web port by default.
Pre-Requisites - Docker
Install Docker on your system before proceeding:
- Linux: Official Docker Engine install guide
- Windows / Mac: Docker Desktop
Verify installation: docker --version && docker compose version
Create the config file next to the compose file:
touch kuvasz.yml
cp .env.sample .env
Then set real values in .env, especially:
POSTGRES_PASSWORD
ADMIN_USER
ADMIN_PASSWORD
Start it with:
docker compose up -d
By default, the snippet binds Kuvasz to 127.0.0.1:8080.
Put it behind a reverse proxy such as Caddy, Nginx Proxy Manager, or Traefik when exposing it beyond the host.
Field Note: Local Docker Trial
I tested Kuvasz locally on 2026-09-04 while many existing containers were already running.
To avoid touching them, I used:
- Compose project:
kuvasz_foss_trial - Kuvasz image:
kuvaszmonitoring/kuvasz:4.3.1 - database image:
pgautoupgrade/pgautoupgrade:18-alpine - app port:
127.0.0.1:18080:8080 - no published database port
- unique temporary container names
- temporary files under
/tmp/foss-post/kuvasz-trial
The first attempt used a normal Compose network and failed before starting because this Docker daemon has exhausted predefined address pools for user-defined networks:
all predefined address pools have been fully subnetted
I then reran the trial on Docker’s existing bridge network with a legacy container link between the app and database.
That is not the compose shape I would publish for a clean host, but it was the safest way to run the test here without creating another subnet.
Docker warned that links on the default bridge are deprecated.
The adjusted trial started successfully. Both containers became healthy, and Kuvasz logs reported:
Kuvasz was successfully bootstrapped. Version: 4.3.1
Startup completed ... Server Running: http://...:8080
The health endpoint returned:
{"name":null,"status":"UP","details":null}
The public status page at /status returned HTTP 200 OK and rendered the default System status page.
The authenticated settings API also worked with the configured X-API-KEY and reported installed version 4.3.1, authentication enabled, update checks disabled for the trial, metrics export disabled, and MCP disabled.
After the test, I removed the two trial containers with:
docker compose --project-name kuvasz_foss_trial down
The named trial database volume was left in place for traceability:
kuvasz_foss_trial_db-data
Observability and API Surface
Kuvasz exposes health and application APIs under /api/v2/.
The source and generated OpenAPI spec include API areas for:
- monitors
- HTTP monitors
- push monitors
- ICMP monitors
- TCP monitors
- DNS monitors
- incidents
- integrations
- maintenance windows
- status pages
- settings
- Prometheus metrics
API key access uses the X-API-KEY header.
The MCP server has a separate API key, which is a good boundary because an assistant-facing operations endpoint should not automatically share the same key as the REST API.
Metrics are controlled explicitly. You can enable the top-level metrics export and then choose Prometheus, OpenTelemetry, and specific meters such as HTTP uptime status, latest latency, SSL expiry, ICMP packet loss, TCP latency, DNS latency, and push uptime status.
Notifications
The integration package includes services for:
- email via SMTP
- Discord webhooks
- Slack webhooks
- Microsoft Teams webhooks
- Telegram
- Apprise
- Pushover
- PagerDuty
- generic webhooks
This is a good fit for self-hosters because notification routing is often more personal than the monitor itself.
One monitor may need a PagerDuty route, another may need a Telegram message, and a low-priority homelab check may only need email.
Where Kuvasz Fits
Kuvasz is worth a look when you want:
- uptime monitoring you can self-host
- more monitor types than a simple HTTP checker
- public or private status pages
- YAML-managed monitors and status pages
- Prometheus or OpenTelemetry export
- REST API automation
- optional MCP access for assistant workflows
- Helm deployment for Kubernetes
It is probably not the right fit if you only need a tiny single-binary checker, if you do not want to run PostgreSQL, or if you prefer a hosted service with global monitoring locations managed for you.
Alternatives
Compare Kuvasz with:
- Uptime Kuma for a popular self-hosted uptime dashboard.
- Checkmate for broader infrastructure and container monitoring.
- Netdata for host and infrastructure metrics.
- Kener for status pages and incident communication.
The differentiator for Kuvasz is the combination of multiple monitor types, YAML configuration, status pages, REST API, metrics exporters, and MCP support in one Kotlin/Micronaut application.
Final Thoughts
Kuvasz is a serious self-hosted monitoring project, not just a Dockerized ping script.
The source shows careful separation between monitor types, repositories, schedulers, status pages, integrations, metrics, API controllers, and UI controllers.
The local trial also showed the happy path works with the current 4.3.1 image and PostgreSQL once Docker networking constraints are accounted for.
If you already run Uptime Kuma and want something more configuration-driven, API-oriented, and observability-friendly, Kuvasz is a practical project to evaluate.
FAQ
Does Kuvasz need PostgreSQL?
Yes. The application stores monitors, events, incidents, status pages, and related state in PostgreSQL.
Can I manage monitors from YAML?
Yes. Kuvasz supports YAML-based monitor, status page, integration, and maintenance window configuration. Treat that file as your source of truth if you use it.
Does Kuvasz support Prometheus?
Yes. Metrics export is configurable, and Prometheus export can be enabled explicitly.
Does Kuvasz replace Uptime Kuma?
It can for some users, but the product shape is different. Kuvasz leans harder into YAML configuration, API automation, multiple monitor types, metrics export, and MCP support.
Did this test affect existing Docker containers?
No existing containers were modified. The trial used a separate Compose project, local-only port binding, and temporary names. The two trial containers were removed after testing.
Comments