A Data Analytics Career: Updated June 2023
Data analysts are now considered invaluable assets in virtually every industry, from tech to healthcare, retail to finance, and everything in between. They possess the unique ability to mine data, interpret it, and present it in a way that businesses can use to make informed decisions.
Starting a career in data analytics is a journey of personal growth and continuous learning. You’ll need to build a strong foundation in various areas such as statistical analysis, programming languages like Python or R, data visualization, and machine learning, among others.
But don’t let these requirements intimidate you. With the right mindset and approach, anyone can master the fundamentals and pave their way towards a successful career in data analytics.
- I have divided this post in three parts:
- If you are a techie already, make sure to have a look to how to get better in business skills.
- If you are a master in business skills already, having tried some of these technologies will make you propose better solutions and better manage your team.
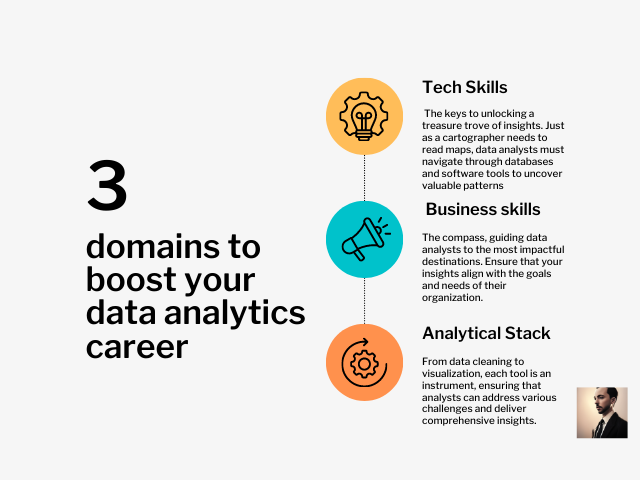
Tech Skills
To become a successful Data Analyst, you need to have a wide range of technical skills. These include knowledge of Structured Query Language (SQL), Microsoft Excel, critical thinking, R or Python-Statistical Programming, Hadoop Platform, SQL Database/Coding, Apache Spark, Machine Learning, and AI.
Additionally, data analysts should have a strong understanding of computer science and be proficient at coding in Python. Finally, data analysts should also be comfortable with large data sets and have the ability to process them efficiently.
Programming Skills
Think of programming skills as a cognitive enhancer that sharpens problem-solving skills and encourages a structured approach to challenges. It’s like a mental gym that builds analytical thinking, attention to detail, and the ability to break down complex problems into manageable parts.
-
Learn Python: is very a versatile, widely-used and offers extensive libraries and tools for data manipulation, analysis, and visualization, making it invaluable in data analytics.
- You can leverage your Python) knowledge with the new language - Mojo, a superset of Python that is designed for AI tools and is way more faster.
- With everything that is going on within the Generative AI space, having at least some Python Knowledge is essential.
-
Learn SQL: SQL (Structured Query Language) is essential for querying and managing relational databases, allowing data analysts to access, filter, and manipulate large datasets efficiently and effectively.
-
Learn R): a powerful, specialized language tailored for statistical analysis and data visualization, providing data analysts with a vast array of statistical techniques and graphing capabilities
Basic programming skills serve as a gateway to generative AI, much like learning to read allows you to access a library of infinite stories.
GIT - A Cloud for…code? 📌
Think of Git as a time machine that helps you save snapshots of your code’s progress. It tracks every change you make, allowing you to go back in time and see how your story evolved.
Some well known sites where you can store your code:
- Github - (Microsoft)
- Gitlab - (Private) but CE version available F/OSS and Self-Hosted
- Bitbucket - (Private), it integrates with Jira (Atlassian)
- Gitea - Free Open Source and Self-hosted
Learn Web Basics - Show your Work!
- I would recommend starting with having a good Readme.md as an intro in your Github profile.
- You can use .md (Markdown)
- Or HTML directly in that file as well if you are familiar with it
Static Site Generators - SSG
To have a better Portfolio/Blog/Docs with your projects, you can use Static Site Generators.
Personally, I find HUGO a fantastic option (I migrated this blog to HUGO from WP) and its not hard to get started.
Im not yet convinced to have my own Free WebSite, Tell me More 👈
- But summing it up the pros are:
-
It’s Free and Open Source
-
There are great themes that you can use as your web scheleton:
- I am using PaperMod with some tweaks
- Allow you to learn some HTML and css on the go while customizing it
-
You can deploy and host it for free:
- To a github repository (Github Pages) and have a free Github subdomain to show your website (github.io)
- HUGO With Google’s Firebase: you will also get a free domain (.web.app)
-
Another SSG’s that can serve as HUGO alternatives (free and open source) are:
- Jekyll (Ruby)
- Gatsby (Js)
- Astro
-
Github Pages
The natural next step would be to create a personal Github Page.
- You can consider this as an oportunity to have a resume, portfolio page or even your Completely Free blog
- Thats right, you won’t have to pay for domain nor hosting.
- This is an oportunity to get familiar with CI/CD Tools like Github Actions as well.
Software Development Methodologies (SDM)
Software development methodologies are vital as they provide structure, efficiency, and standardization to the complex process of creating software.
They guide teams through each stage of the project, from initial planning and design to implementation and maintenance, ensuring that all aspects are coordinated and goals are met effectively.
They help manage risks, control quality, and accommodate changes or constraints, ultimately leading to the successful delivery of high-quality software that meets user needs and expectations.
Here is where you get to Know about Waterfall and Agile 👇
Waterfall: plan, then develop
The Waterfall methodology is a linear project management approach in software development, where stakeholder and customer requirements are gathered at the beginning of the project, and progress flows in a single downward direction through a series of phases.
It is a good choice for projects with a clear scope and requirements. Waterfall can be inflexible and difficult to change once the project is underway and can lead to project delays and budget overruns.
These phases typically include Requirements gathering and analysis, System Design, Implementation, Testing and Deployment, and Maintenance. Each phase builds on the results of the previous one and must be completed before the next phase can begin.
The Waterfall model is popular in software engineering and product development and is considered to be one of the less iterative and flexible approaches.
Picture this: you’ve got a bunch of different LEGO pieces, and you’re building your castle one layer at a time. It’s like assembling your castle in a straight line, top to bottom, without going back. You can’t change the color of the bricks in the walls once you’ve moved on to the next layer.
Agile: Develop while adapting
Agile is an iterative and collaborative approach to project management and software development that emphasizes flexibility, adaptability, and continuous improvement.
It is a good choice for projects with a complex or uncertain scope. Well-suited for projects with changing requirements. Bit it may not be a good choice for projects with a limited budget or timeline.
- There are few frameworks/methodologies that fall under the umbrella of Agile. They provide specific approaches and practices for implementing Agile principles in project management and software development processes.
- Scrum: Scrum is an Agile framework that emphasizes teamwork, collaboration, and iterative development. It involves dividing work into time-boxed iterations called sprints, with a focus on delivering value incrementally and adapting to changing requirements.
- Grooming
- Planning Sessions
- Retrospectives
- Scrum: Scrum is an Agile framework that emphasizes teamwork, collaboration, and iterative development. It involves dividing work into time-boxed iterations called sprints, with a focus on delivering value incrementally and adapting to changing requirements.
- Kanban: is an Agile methodology that visualizes work as it moves through different stages. It utilizes a Kanban board to provide visibility into the workflow, limit work in progress (WIP), and optimize the flow of tasks.
- ScrumBan: is a hybrid approach that combines elements of Scrum and Kanban methodologies. It aims to leverage the strengths of both frameworks to enhance productivity and flexibility in project management
- Other Agile methodologies: Lean, Extreme Programming (XP), and Dynamic Systems Development Method (DSDM)
Now, let’s imagine you’re building another LEGO masterpiece, but this time you’re going Agile! You start by building a small part of the castle—a tower, maybe. You don’t need all the details upfront; you just want to get something functional as quickly as possible.
You show this mini-castle to your friends (stakeholders) and ask for their opinions. They might say, “Hey, this tower is great, but can we add a drawbridge?” So, you add the drawbridge. Then they say, “Actually, could the tower be a bit taller?” You make it taller. You’re constantly adapting and improving, building bit by bit, based on feedback and changing needs. You’re not stuck with one set plan; you can switch things up as you go along.
In the software development, the Agile Manifesto encourages teams to value individuals, embrace change, and work together to deliver functional solutions that meet customer needs
Business Skills
Product and Sales - The Vision
Having Product Vision helps data analysts align our work with the larger objectives of the product and the company, making our contributions more valuable and impactful.
The product vision serves as a guiding light for any data analyst, providing a clear direction for our work. It allows us to understand the broader context of their analyses and the ultimate goals of the product, which can help to prioritize tasks and focus the efforts on the most impactful areas.
- The Pareto Principle application is fundamental (yes, also here):
- Understand productivity peaks and that ~80% of user satisfaction will come from ~20% of tasks
- Or that ~20% of the features will be giving the customer ~80% of the product they need - Focus in the Vital Few
Having Sales Vision allows data analyst to tailor the analyses and models to identify key metrics that demonstrate the value of a data product or business idea, or we can use data to tell compelling stories that persuade potential customers or stakeholders. The sales vision also helps the data analyst understand the target audience, which can inform their work.
- How to start to cultivate the sales vision?
- What are you selling?
- Do you know why your client’s needs it?
I was lucky to work early in my career in supply chain and discovered value stream mapping.
Why should we care about that? Very simple, your customer is probably delivering some product/service to someone else - get to know what is that they need, make sure you solve the essence of your customer problem (add the biggest value possible) and they will be really happy with you and your work.
BA Skills
Even if you won’t be performing the pure role of a Business analyst, is great that you keep in mind the main points of the BA role as well as the main BA concepts to speak their language.
If you are in a rush, here is a list of bullet points:
-
Be aware of the of the required change inside an organization by identifying problems and suggesting solutions that benefit your stakeholders:
- Never loose the general picture of why you do what you do
- Focus to understand the ultimate goal of your tasks
- Learn how to form a good KPI for your business purpose
- What are the needs we are trying to satisfy?
- What are the contexts that we and the solution are in?
- Never loose the general picture of why you do what you do
-
Get to know ALL the people involved and their role:
- You will know who to reach in case of any blockers
- Dont wait for your manager to solve all people communication - drive it yourself
- Excel at creating summaries - Make sure that everyone (including yourself) is on the same page, understanding which will be their contribution to the solution and in which step of the process their input will be required.
- Make sure that everyone have agreed to the previous step
- All interested stakeholders must feel heard, that their perspectives count, and that their contributions are valued in order to create genuine stakeholder engagement.
- Remember about the RACI matrix as it defines roles and responsibilities for each task or decision in a project, ensuring accountability, and facilitating effective communication and coordination among team members.
- Quality is ultimately determined by stakeholders!: The UAT
-
Understand how to get proper requirements and maintain their lifecycle:
-
Requirements gathering ensures that everyone involved—team members, stakeholders, and clients—shares a common understanding of the project’s goals, scope, and desired outcomes. It’s like gathering all the puzzle pieces before you start assembling the picture.
-
Distinguish between Functional and Non-Functional Requirements
-
Functional requirements are like the ingredients in a recipe, defining what a system or product should do—just as a cookbook outlines the steps to make a dish. They specify the features, actions, and behaviors, like a recipe listing ingredients and cooking instructions.
-
Non-functional requirements, on the other hand, are like the qualities that make a meal memorable, focusing on how well the dish is prepared rather than its components.
- Performance, Scalability, Availability, Usability…
-
-
Asking the best possible questions
- Be sure that the stakeholders with approval authority comprehend and agree with the requirements
-
The documentation process is key
- Be sure that you have good notes and that all stakeholders can understand them
-
Priority Setting:
- Understand which tasks are conforming the critical path of the solution and tackle them
- Be aware of the time sensitivity of the tasks - Understand deadlines
- Knowing about Kanban or Eisenhower matrix (Urgency vs Importance) will be beneficial
-
Just as a juggler focuses on catching the right ball at the right time to keep the show going smoothly, setting priorities ensures that your attention is directed towards tasks that move the needle.
-
Estimations:
- Having a global picture of the dependencies is key for estimations
- If several teams are involved, keep in mind their constrains as well (people, technical, process…).
- Some good practices to consider when estimating data analysis tasks:
- Break Tasks into Smaller Pieces: Decompose complex data analysis tasks into smaller, more manageable sub-tasks. This allows for more accurate estimation and better understanding of the effort required for each component.
- Leverage Historical Data - Take from your previous experiences the time that similar tasks required to be finished
- Define Clear Objectives: Clearly define the goals and deliverables of the data analysis task upfront. Having a clear understanding of the desired outcomes helps in estimating the necessary steps and resources required to achieve those objectives.
- Buffer for Unexpected Challenges: Account for potential unforeseen challenges or dependencies that may arise during the data analysis process. Add a buffer in the estimation to accommodate these uncertainties and mitigate risks.
- Bottom-Up Approach + Buffering or Analogous Estimations can serve a starting point
- Validate and Review: Regularly review and validate the estimation against the progress of the analysis task. Adjust the estimation if necessary based on real-time feedback and evolving project requirements.
-
Estimations are the compass that guides a project through the uncharted territory of time and resources. Just as a traveler relies on a map to navigate, accurate estimations provide a roadmap for planning, allocation, and decision-making. They set realistic expectations, helping stakeholders understand project timelines, costs, and potential risks.
-
-
While collecting requirements, be sure that the follow these principles:
- Atomic: self-contained and capable of being understood independently of other requirements or designs.
- Feasible: reasonable and possible within the agreed-upon risk, schedule, and budget, or considered feasible enough to investigate further through experiments or prototypes.
- Testable: able to verify that the requirement or design has been fulfilled. Acceptable levels of verifying fulfillment depend on the level of abstraction of the requirement or design.
- To prepare for requirement gathering:
- Ensure all needed resources are organized and scheduled for conducting the elicitation activities
- Gather information before the session (From documents, other teams…): Who are the stakeholders, what are their needs, prioritize the requirements.
- Output: the list of features that the stakeholders need (also non- functional requirements like performance, security, usability…), use cases and acceptance criteria.
- Ensure all needed resources are organized and scheduled for conducting the elicitation activities
-
Be ready for Change Requests: propositions to change to the scope, schedule, or budget of a project.
-
Be proeficient at creating wireframe and mockups
Wireframes and Mockups provide a tangible preview (low and high fidelity respectively), helping to refine ideas, gather feedback, and ensure everyone’s on the same page before the actual work begins. It’s like a sneak peek into the future, letting you shape and refine your vision before bringing it to life.
Project Management
Now you know what your client needs, the product is defined and they have agreed to go ahead with your solution. It is time for us to plan our project and to be able to deliver and meet the customer’s expectations:
A project manager ensures that timelines, resources, and tasks harmonize seamlessly, while also adapting to unexpected changes. By providing a clear roadmap and fostering effective communication, project management empowers each member to contribute their expertise, leading to success.
Its all About Delivering 🏃
- Understand the Critical Path of the project
- Learn to prioritize (for you and for others).
- A good reference is the 80/20 Principle
- In the end of the day, it’s all about Time Management
- You can get help from free tools like:
- Learn to prioritize (for you and for others).
- When starting a project, be sure that you follow a Project Charter - this document defines the objectives, scope, and stakeholders of a project, providing a roadmap for the team to follow.
- There is a great example, provided by Microsoft on their Github.
- Risk Assesment - There are different models:
- Standard Risk Model: Likelihood x Impact
- Become an enabler: understand helping vs enabling
- What is needed from my team so that X will happen in Y conditions?
- Learn to ask more and better questions
- Delivering bad news: is never easy, but it is important to do it in a way that is honest and respectful.
- By openly addressing setbacks and potential hurdles, project managers help everyone brace for impact and work together to find solutions.
-
Just as a captain communicates potential turbulence to passengers before it happens, project managers set expectations by keeping stakeholders informed about challenges, delays, or unexpected issues that might arise during the project journey.
- Be ready for difficult questions:
- Rephrase the question. If you’re not sure what the question is asking, ask the person to rephrase it. This will give you a chance to process the question and to formulate a response.
- Ask for clarification. If you still don’t understand the question, ask for clarification. This will help you to make sure that you’re answering the question that was asked.
- Avoid getting defensive. If the question is critical or challenging, don’t get defensive. Instead, try to see the question from the other person’s perspective and to respond in a respectful way.
Effective Meetings
I know I am a little bit obssesed with efficiency…but
When collaborating with others, you have to be sure to make the best possible use of their time and how to run effective meetings is something that we have to keep in mind.
Meetings serve as crucial checkpoints, where participants share updates, exchange ideas, and troubleshoot issues. Think of effective meetings as opportunities for synergy –where the combined efforts of individuals create something greater than the sum of its parts. They contribute to the rhythm of progress and keep the project’s momentum flowing.
Simple way to be Top 1% in Data Analytics ✌️
Agenda
- Make sure all stakeholders are invited ( again, RACI )
- Provide Context
- The Meeting Goal!!
Create Summaries
Condense the ideas as time and audience’s attention is limited:
- WHAT was discussed?
- WHAT was agreed?
- WHAT are the next steps?
A Table with the following structure can be of help to keep everyone informed (again, remember about RACI Matrix):
| Goal | Task | Blockers | Due Date | Comments |
|---|---|---|---|---|
Soft Skills
Be Curious (and Share IT)
Do you have any analysis that you would like to see but havent found it on the internet?
Chances are that you can find data to do it yourself. Use the tools that you are learning to discover insights that you are curious about, that will boost your motivation to keep learning.
- For example:
- I wanted to have a bigger picture on my bike routes, that led me to learn about leaflet and finally create a repository with the code to analyze routes.
When we share what we’ve learned, we equip others with new tools for exploration and understanding. As we pass on our insights, we invite fresh perspectives, sparking creativity and collaboration.
Broaden yours and others Perspectives
One of the key aspects that imo helped me to change my career towards data analytics, is the fact that I retook the habit of reading.
- We have to be aware and understand our possible biases
-
Listen Actively: Focus not only on the words being said but also on the feelings, emotions, and unspoken messages behind them. It’s like putting on a special pair of glasses that help you see beyond the surface.
-
- Understand where the start and end applicability points of our models are
- Learn how to work with different personality types.
- Habit building is key
- Observe how the tech/soft skills describe are inter-related -> Embrace the power of T-Shape skills
Mentoring is like having a wise friend who shares their experiences and advice to help you grow and succeed. They guide you based on their own journey, offering insights and suggestions.
Coaching, on the other hand, is like having a skilled trainer who asks you thought-provoking questions to help you discover your own solutions and reach your goals. They help you find your way by drawing out your strengths and helping you overcome obstacles. While a mentor shares their wisdom, a coach empowers you to unlock your potential through self-discovery.
- Provide constructive feedback:
- Be specific. Don’t just say “good job” or “bad job.” Instead, be specific about what the person did well or could improve on. For example, you could say “I really liked the way you organized your presentation” or “I think you could have improved your presentation by adding more visuals.”
- Be timely. Don’t wait too long to provide feedback. The sooner you provide feedback, the more likely the person is to be able to use it to improve their performance.
- Be positive. Focus on the positive aspects of the person’s performance, even if you also have some areas for improvement. This will help the person to feel more motivated to make changes.
The Analytical Stack
Data profiling is the process of inspecting, cleaning, and analyzing data to understand its content, quality, and structure. It is a critical step in the data preparation process, as it can help to identify data quality issues and ensure that the data is fit for use. And yes, you will be using it every day.
- You will be interested in:
- Identify data quality issues: Data profiling can help to identify data quality issues such as missing values, duplicate records, and invalid data types.
- Understand the data: Data profiling can help to understand the data by identifying its content, quality, and structure. This information can be used to make informed decisions about how to use the data.
- Prepare the data for analysis: Data profiling can be used to prepare the data for analysis by cleaning it and ensuring that it is fit for use.
- Identify data trends: Data profiling can be used to identify data trends by analyzing the data for patterns and anomalies. This information can be used to make informed decisions about the business.
Data profiling is like examining a treasure map to understand what kind of treasures it might lead to. Just as you study the map’s details, data profiling involves analyzing a dataset to uncover its hidden secrets ( data’s quality, structure, patterns…) so you can predict what valuable insights or challenges might be waiting.
Databases
A database is an organized collection of data that is stored electronically in a computer system. It is a repository of information that can be easily accessed, managed, and updated.
Databases are a powerful tool for storing and managing data. They are used in a wide variety of applications and can help businesses to improve their efficiency, productivity, and decision-making.
- Relational databases are the most common type of database. They are designed to store structured data in tables. Each table has a schema that defines the columns in the table and the data types of the columns. This makes it easy to store, query, and analyze structured data in relational databases.
- NoSQL databases are a newer type of database that are designed to store semi-structured and unstructured data. NoSQL databases do not have a schema, which makes them more flexible than relational databases. However, this also makes it more difficult to store, query, and analyze data in them.
- MongoDB: MongoDB is a document-oriented database that is designed to store semi-structured data. MongoDB documents are JSON objects, which makes it easy to store and query semi-structured data.
- Cassandra: Cassandra is a distributed database that is designed to store large amounts of data. Cassandra is a good choice for storing unstructured data, such as log files or sensor data.
Databases are managed by a database management system (DBMS). The DBMS is responsible for storing the data, ensuring its integrity, and providing access to the data for users.
There are many different DBMSs available, each with its own strengths and weaknesses. Some popular DBMSs include different flavours of SQL: MySQL, PostgreSQL, Oracle, and Microsoft SQL Server.
Databases Concepts
Normalization is a process of organizing data in a database in a way that minimizes redundancy and dependency. Redundancy is when the same data is stored in multiple places in the database. This can lead to problems, such as data inconsistency and wasted space. Dependency is when one piece of data depends on another piece of data. This can also lead to problems, such as data integrity issues.
There are five normal forms (1NF, 2NF, 3NF, BCNF, and 4NF) that can be used to normalize a database. Each normal form builds on the previous normal form, so a database must be in at least 1NF before it can be in 2NF, and so on.
For example: 1NF (First Normal Form): A table in 1NF is in first normal form if it does not contain any repeating groups. This means that each row in the table must be unique, and no column can contain multiple values.
Normalization ss a process used in database design to arrange data efficiently and logically. Just as grouping books by genre or author helps readers find what they’re looking for, normalization involves breaking down data into smaller, related tables and reducing redundancy.
Cardinality is a measure of the relationship between two tables in a database. It is expressed as a pair of numbers, such as 1:1, 1:N, or M:N.
Cardinality helps designers know whether each record in Table A corresponds to one, many, or no records in Table B.9
ER vs Dimensional Modelling
ER modeling is a more general-purpose modeling approach that can be used for a wide variety of applications. It is a good choice for applications that need to model complex relationships between entities. However, ER modeling can be more complex than dimensional modeling, and it can be less efficient for data warehouse and BI applications. You should relate it with: OLTP, normalized schemas and low redundancy.
Dimensional modeling is a specialized modeling approach that is typically used for data warehouses and BI applications. It is a good choice for applications that need to analyze large volumes of data quickly and efficiently. Dimensional modeling is less complex than ER modeling, and it is typically more efficient for data warehouse and BI applications. Relate it with: DWH’s, star and snowflake schemas, OLAP, de-normalized schemas and high query speed.
- The main difference between a star schema and a snowflake schema is the level of normalization. A star schema is more normalized (less redundant) than a snowflake schema.
- A star schema is a simple, normalized dimensional model that consists of a fact table and several dimension tables. The fact table contains the measures of the business, and the dimension tables contain the attributes that describe the measures.
- A snowflake schema is a more complex, denormalized dimensional model that consists of a fact table and several dimension tables. This can improve performance for queries that only need to access a subset of the data in the dimension table.
I need an example 👇
Imagine you’re managing a bustling retail store, and you want to analyze your sales data to understand which products are selling well and who your most loyal customers are.
The “Fact” table in this scenario is like a ledger where you record every transaction that happens in your store—a list of all the sales made, including the products bought, the prices, and the dates. This table captures the heartbeat of your business, showing the actual sales activities.
Now, think of “Dimension” tables as labels that provide extra information about your products and customers. For instance, you might have a “Product” dimension table that includes details about each product’s category, brand, and supplier. Another dimension could be the “Customer” table, which includes demographic information like age, location, and loyalty status.
When you combine the “Fact” and “Dimension” tables, you’re not just looking at rows of sales data—you’re building a story. You can discover insights like which product categories are most popular among specific customer groups, or whether loyalty members tend to buy certain types of products more often. By weaving together these elements, you create a powerful narrative that helps you make informed decisions and optimize your store’s performance.
Data Warehouses
A data warehouse is a specialized database that is designed for storing and analyzing large amounts of historical data. It is used to support business intelligence (BI) and analytics applications.
Data warehouses are typically used by businesses to track their performance, identify trends, and make better decisions.
This data is typically structured, because it is easier to store and query structured data. However, data warehouses can also be used to store real-time data, such as sensor data or social media data. This data is often semi-structured or unstructured, because it is difficult to predict the format of this data.
If you are storing semi-structured or unstructured data in a data warehouse, then you will need to use a tool to transform the data into a structured format before it can be stored in the data warehouse. This process is called ETL (extract, transform, and load).
Specifically designed to support OLAP operations. They store large amounts of historical and transactional data in a structured format optimized for analytical processing.
- The data in a data warehouse is typically organized into dimensions and measures, forming a multidimensional model that allows for slicing, dicing, drill-down, and roll-up operations.
- You will need to understand how ETL and ELT compare in DWH Architecture as Data Integration Methods
- As well as the STAR vs SNOWFLAKE schemas as the DWH Dimensional Modelling Approaches
- Data Modelling will be fundamental
DWH’s and Data Marts Examples
Some DWH Examples
- BigQuery is an example of a cloud-based data warehouse offered by Google Cloud. It is a serverless and highly scalable platform that allows users to analyze massive datasets using SQL queries.
- Other well known data warehousing solution include is Snowflake:
- Snowflake follows a multi-cluster shared data architecture, where compute and storage are separated. This allows for scalable compute resources and on-demand scaling.
- BigQuery, on the other hand, utilizes a columnar storage system with a serverless architecture that automatically scales resources as needed.
- Snowflake uses a structured, optimized storage format called Micro-partitions, which allows for efficient data storage and query performance.
- BigQuery employs a columnar storage format called Capacitor, which compresses and stores data column-wise, enabling high performance for analytical queries.
- As well as: Amazon Redshift, Microsoft Azure Synapse Analytics
Data Marts
A data mart is a subset of a DWH that is designed to support a specific business unit or department. Data marts are typically smaller and more focused than data warehouses, and they are often used to support decision-making and analysis for a particular area of the business.
For example, a retail company might have a data mart that contains data about customer sales, product inventory, and marketing campaigns. This data mart would be used by the marketing department to track the effectiveness of marketing campaigns and to identify trends in customer behavior.
Data marts are often used to improve the performance of queries and to reduce the load on the data warehouse. This is because data marts are typically smaller and more focused than data warehouses.
Data Lake (Houses)
- Data lakes are a good choice for storing large amounts of data of all types, including structured, semi-structured, and unstructured data. However, data lakes can be difficult to manage and query, and they can be slow for analytical workloads.
- We already learnt about Data warehouses are a good choice for storing structured data for analytical workloads. However, data warehouses can be expensive to build and maintain, and they can be difficult to scale.
- Data Lake Houses enable organizations to store and process raw data while maintaining the ability to apply structure, governance, and efficient querying for analytics purposes.
- It uses a data lake to store all of the data, and it uses a data warehouse to provide a layer of structure and governance for the data. This allows businesses to store all of their data in a single repository, and it allows them to use the data for both analytical and operational workloads.
- In many Data Lake house arquitectures, you will find Databricks as the unified data analytics platform, powered by Spark.
Data Integration Services
It’s all about bringing data together from different places and making it work together effectively.
- They combine data from multiple sources into a unified and coherent view, enabling organizations to gain insights, make informed decisions, and drive business value.
- Data integration services help overcome the challenges of data silos, where information is scattered across various systems or departments.
- One example of a data integration service is Azure Data Factory (ADF). ADF allows you to create data pipelines that connect to different data sources, such as databases, cloud storage, or web services, and bring the data into a central location.
- Google Cloud and Amazon Web Services (AWS) offer their own equivalents to Azure Data Factory for data integration services: Google Cloud Data Fusion and AWS Glue.
Visualizations
- Mind the end user experience. You will benefit of this UI/UX overview.
- Make sure that the UI is usable
- The UI is important, but how you tell the story will make the difference.
- Having some best practices in mind about Business Intelligence skills will be beneficial.
- Experiment with the wireframes and mockups to prototype and design data visualizations, dashboards, and reports
- Try different layouts, data representations, and interactivity to create engaging and actionable insights for end-users.
The way you present insights is crucial because, just like telling a story with the right tone and pace, choosing the right visualization style and layout ensures that your data’s story is clear and impactful. Whether it’s a bar chart, pie chart, or interactive dashboard, each choice plays a role in guiding your audience through the journey.
Machine Learning
Machine learning is a process by which computers are trained to learn without being explicitly programmed. This is done by feeding the computer with data and allowing it to identify patterns in the data. Once the computer has identified patterns, it can use these patterns to make predictions about new data.
With labels or without labels - that’s the ❓
-
The supervised machine learning approach requires you to start with a dataset with known label values. Two types of supervised machine learning tasks include regression and classification.
- Regression: used to predict a continuous value; like a price, a sales total, or some other measure.
- Classification: used to determine a class label; an example of a binary class label is whether a patient has diabetes or not; an example of multi-class labels is classifying text as positive, negative, or neutral.
-
The unsupervised machine learning approach starts with a dataset without known label values. One type of unsupervised machine learning task is clustering.
- Clustering: used to determine labels by grouping similar information into label groups; like grouping measurements from birds into species.
-
One of the reasons that motivated me to improve Python Skills, was Machine Learning
- Once you are confortable enough, you can also check also the concepts of ROC and A|B Testing.
- Remember that you can apply ML concepts together with Big Data Processing tools like Spark
Remember - It’s all about the trade-off.
In the World of machine learning, overfitting means your model is too focused on the training data, missing the bigger picture. Underfitting means it’s not capturing the patterns in the data. Just like in basketball, the goal is to find that perfect balance where your shots (or predictions) are consistently accurate.
Cloud / DevOps
Learn Linux - Don’t be Scared of CLI
I mean, dont be afraid of it. Neither of the terminal.
Think of the command line as your magical wand. In Linux, you can use text commands to summon powers, create spells (programs, scripts), and control the world around you.
You can start trying it with a Virtual Machine or booting it from an USB - so you will be sure that nothing will break.
Linux is often used in cloud servers because it is a reliable, open source operating system that is highly scalable and power-efficient.
Feel free to have a look at my repository and Github Page for Linux to learn useful tips to get started. I was including there the notes I wished to have found on the internet when installed it for the first time.
Learn Docker
Docker is a powerful tool for quickly deploying and managing applications. It allows developers to create and deploy self-contained applications that can run on any machine without needing to install or configure any additional software.
This makes it easier to quickly deploy applications across different environments and makes sure that applications run consistently.
Think of Docker as a backpack that holds entire software worlds—applications, libraries, settings, and more—all neatly packed and ready to go.
Too abstract? Docker basically avoids the ‘it works in my computer’ situations.
This Docker Thing sounds interesting 😮
When you build your confidence in it, you can try any cloud provider, normally they offer free-tiers where you can start, for example, trying Docker for the first time, testing how to build a website and so on.
Additionally, Docker allows developers to share applications with others, allowing for collaboration and faster development cycles. What it is called as CI/CD.
- For a Quick Guide on Docker you can check this 101 Guide
- I also have one Github Repository with example Docker configuration files
- If you want to go deeper into CI/CD - you can check how to setup Github Actions and how it compares to build Docker images locally. Also there are open source CI/CD Tools to help us make our dev’s workflow more efficient.
- Youtube is a great source for great tutorials too: Christian Lempa, Tech with Nana, NetworkChuck, Pelado Nerd (in Spanish), DB Tech… I will never be able to thank them enough for all they have taught me already (and to other great channels that would make the list too long). Again, for free.
Bonus - Self-Hosting
In my case, I started Self-hosting with a Raspberry Pi and also created one Github Repository with a Github Page to make easier the start of non-tech users to this interesting world.
Think of self-hosting as building your own digital kingdom — where you have control over your data, services, and the environment in which they operate.
I would start by focusing on containerizing - making sure that your work is reproducible by others
Why Self-Hosting will make you a better at Data Analytics? 👈
Also, you can containerize some of your applications and self-hosted in this way. For example a Shiny / DASH dashboard and create a container with it, share it to a container registry.
In this way, you will learn more about docker files, base images and so on. This might get useful when collaborating with development and teams - as well as sysadmin/infraestructure people.
- These will be welcome in Data Analytics:
- Python Apps: You can see one example of a containerized Python DASH App in my Trip Planner App with Weather
- R Apps: It would be great to know how to avoid the it works on my computer moment with R applications as well. I love using R Shiny with Docker
Not enough? ☁️
Kubernetes - K8s
K8s is a container orchestration platform that automates the deployment, scaling, and management of containerized applications.
Imagine you’re in charge of a space station orbiting Earth. Your job is to manage a crew of astronauts, allocate resources, and make sure everything runs smoothly. Now, think of your crew as software applications and your space station as a powerful platform for managing them—that’s Kubernetes!
CI/CD
Imagine you’re a master chef running a restaurant. You want your delicious dishes (software) to reach customers’ tables quickly and consistently. That’s where Continuous Integration and Continuous Deployment (CI/CD) come in—a set of practices that ensure your software is always fresh and ready to serve.
We talked about Github Actions, but you will also encounter Jenkins, a popular CI/CD tool because it is open source, extensible, and well-documented. It also has a large community of users and contributors, which means that there are many plugins and resources available to help developers get started with Jenkins.
Prometheus
Prometheus is a monitoring and alerting system that helps developers track the health of their applications.
You’re a guardian, responsible for keeping an eye on the health of everything within your responsability. Now, picture having a magical watchtower named Prometheus that lets you see the heartbeat of your software, ensuring it remains vibrant and trouble-free.
FAQ
Any Career Map?
You can use: https://roadmap.sh/roadmaps